1

I would like to begin putting together a history of the usage of different WebSockets across different parachains and parathreads.

I am relatively new to this ecosystem and have not been about to discover the tools that enable this thus far.

https://telemetry.polkadot.io/ - Seems to be a tool that is accessing similar types of data, however, I'm a JS developer and do not wish to dig into the RUST code. Perhaps that's lazy, sorry.

Any pointers in the right direction are welcomed!

Have a good evening, weekend, month, year and beyond. Long live the Polka!

2
  • Maybe you can clarify a bit? The WS endpoints are typically on RPC nodes (AFAIK it doesn't publish stats, maybe to graphana for the provider of that endpoint for private usage), while telemetry is an (optional) recipient for some running node data. Which stats are you looking for? Commented Mar 26, 2022 at 20:11
  • Not websockets, but here's a nice view of open channels: dotsama-channels.vercel.app/#
    – Squirrel
    Commented Mar 26, 2022 at 21:48

2 Answers 2

5

Since this was tagged polkadot-js-api I will give you the JS API perspective on this. The JS API basically only wraps what the Node & runtime exposes. This means -

  • For the Node, all the RPC functions exposed are mapped and the JS API provides you an interface to them on api.rpc.*
  • For the runtime, all the storage, extrinsic, const, etc. endpoints exposed by the runtime is mapped, providing you are interface on api.{tx, query, consts, ...}.*

Since you mention telemetry, the actual data that is being passed through to telemetry is not actually available via RPC (and it is an optional push from the nodes and can be switched off), and if it was available it would most probably be behind an unsafe_ RPC, i.e. not exposed by default.

Like with Telemetry, data can also be pushed from the nodes to Prometheus and most of the larger RPC providers (and validators) indeed do that for tracking their own infrastructure. Once again, this is also optional and sensitive to the node operation itself, so there are no "general RPC endpoints" available for this.

The type of information you can get from the @polkadot/api would only be related to chain state, i.e. you can connect to multiple endpoints and then query for eg. the same address. There are some basic RPC endpoints that give you some connection state, but they are limited and generally marked unsafe_.

To summarize: The telemetry data is an (optional) push from nodes to a dedicated, configurable endpoint. The same applies to information from Prometheus, it is an optional push to a dedicated endpoint.

2

I'm not sure what exactly you mean by the point "history of the usage of different WebSockets", but I have a feeling that you are not intending to inspect the packets exchanged via websockets, but rather the "transaction content" between chains. This is an entirely different thing, and if this is the case, I would forget about the websocket aspect altogether - that is all about networking and doesn't help answer your question.

This answer is focused on my assumption about it not being about websocket package content - which could be wrong of course.

Assuming that is the case, I would add to @Jaco response by stating that indeed the libraries he indicated (and developed) are what you need from a technical point of view especially if you are using javascript.

What you are really looking for are a subset of transactions that are being executed on a parachain - perhaps not the full set of transactions.

That subset would be all transactions coming from and going to other parachains, possibly via the relaychain and having some implication for storage on the source and target parachains.

Bear in mind that a transaction has three components:

  1. the content of the transaction (transactions also known as extrinsics)
  2. if the processing produces a successful outcome for the entirety of the transaction (if not then of course there are error messages and events to collect)
  3. the state changes stored in the blockchain if the transaction was successful

And this should really relate to the following endpoints, which you can inspect as follows (I use Polkadot as an example):

Polkadot Chain State (storage)

Downward messaging protocol - dmp dmp

Horizontal Messaging Protocol - hrmp

This is also available as an extrinsic which you can visit from PDJS Apps hrmp

Upward Messaging Protocol - ump

Cross Chain Messaging Protocol - xcmPallet

Also available as an extrinsic - and you can see the various endpoints by selecting the second menu in PDJS Apps
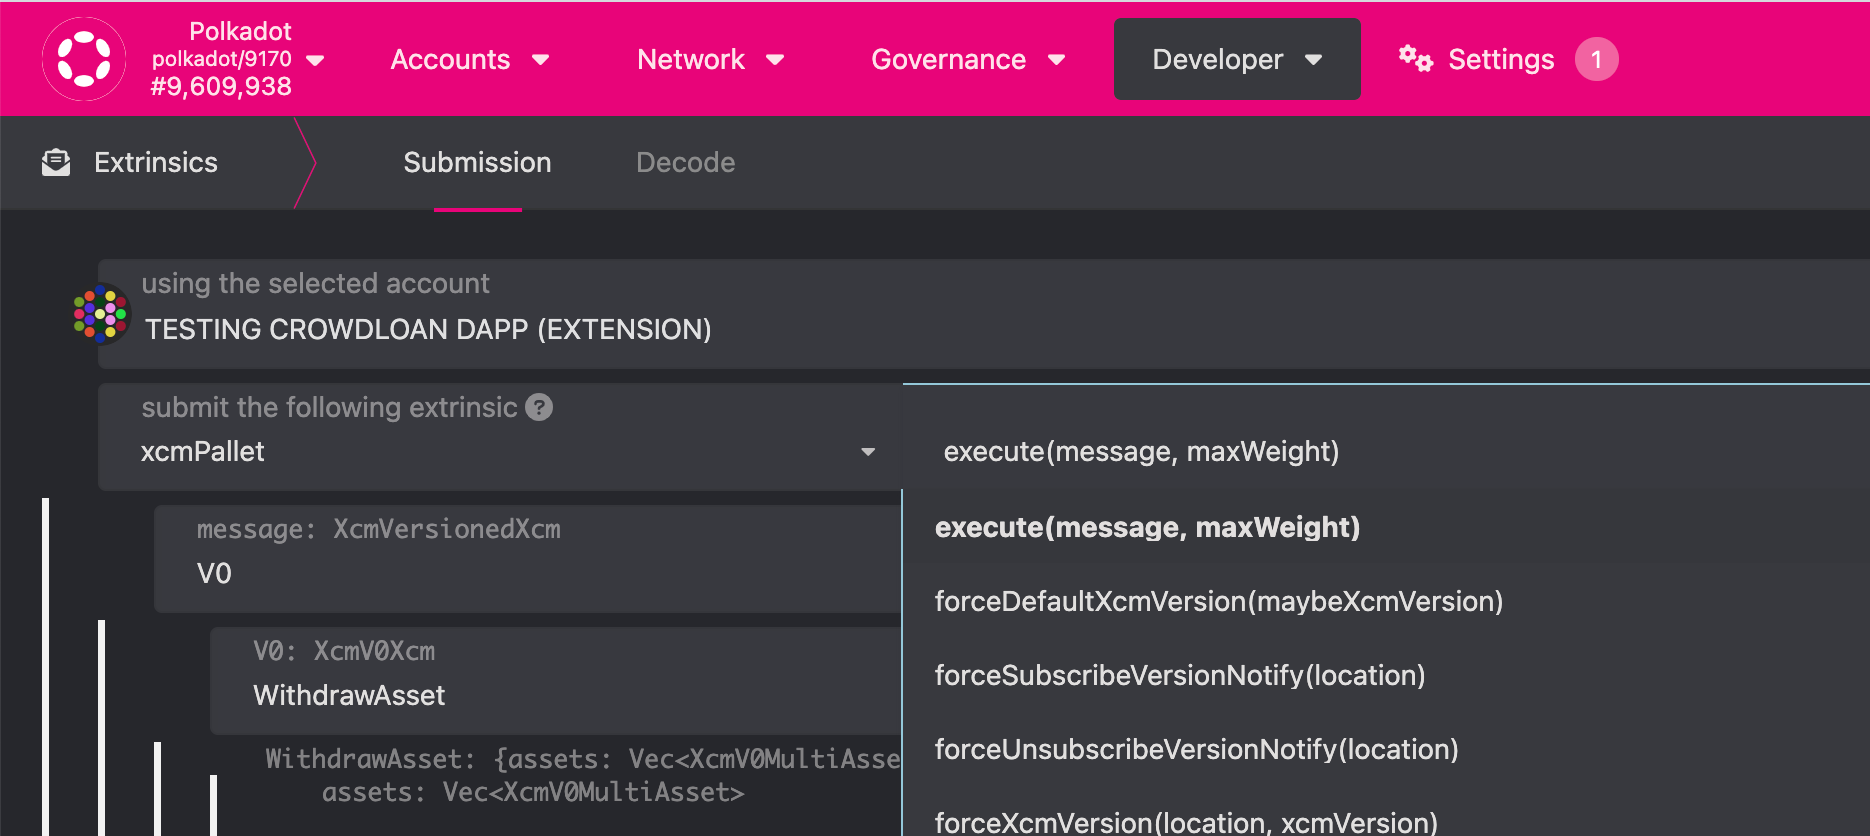
enter image description here

From the perspective of a parachain, I will use Statemint as the example for storage endpoints, which for a parachain are the same for extrinsic endpoints. (i.e. they are from the same pallets.)

  1. Downward Message Protocol Queue - dmpQueue

  2. PolkadotXCM

  3. xcmpQueue

I mentioned Events and Errors. These are issues at the time of the transaction, and are commonly available either at the moment they are issued, or by inspecting the specific block that the transaction was executed in (failed or not).

The last point is about history. Whilst you can of course run a node yourself (you will need to run both the relay chain and all parachain nodes you want to inspect) bear in mind that the history would better be stored in a dedicated database for performance reasons, and because eventually nodes that are not full archive nodes will be pruned.

Storing history also has another benefit in that you do not have to be constantly online to monitor the responses(Events and errors) from transaction, but can parse the contents of blocks whenever convenient to catch up.

3
  • Thanks for your response. It's very helpful. "history of the usage of different WebSockets" <- What I mean by this ... I want to know, for example - Given a specific era, how many transactions on the PolkaDot mainchain were processed by Parity, OnFinaility and Dwellir? 80% Parity 5% OnFinality 15% Dwellir Commented Mar 27, 2022 at 10:18
  • This is a misunderstanding of how blockchains work. You cannot actually know this because these websocket endpoints don't "process transactions"the entire network does the "processing" to reach consensus. Furthermore transactions can be relayed to the network simply by running your own node without needing a public endpoint. This is in fact how parachains send their blocks to Polkadot, but thats a different question.
    – T9b
    Commented Mar 27, 2022 at 10:53
  • If you want stats on number of connections over time you should probably contact the teams doing the hosting, but even then you will never be able to discover how many transactions are "first seen" by a particular node. Many nodes may not even be public for example for exchanges.
    – T9b
    Commented Mar 27, 2022 at 10:55

Your Answer

By clicking “Post Your Answer”, you agree to our terms of service and acknowledge you have read our privacy policy.

Not the answer you're looking for? Browse other questions tagged or ask your own question.